
2025 wasn’t one market. It was a multi-speed waterfront environment – fast in some areas, slow in others – because selection grew dramatically.
-
Where buyers have leverage now (and why): selection is deeper, so negotiating power shows up in time, terms, and price – depending on township.
-
The pricing mistake that quietly costs a full season: “testing” too high in a selective market creates time, and time creates leverage against you.
-
What “selective” actually means in 2026: great listings still sell – average listings sit.
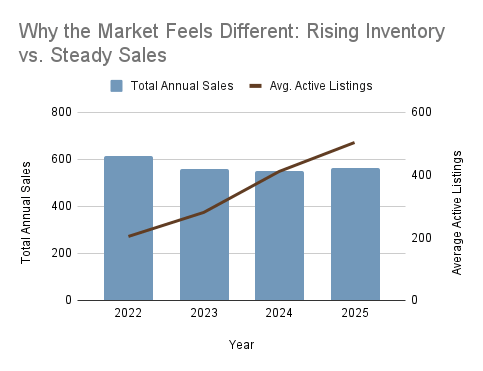
The one chart that explains 2025

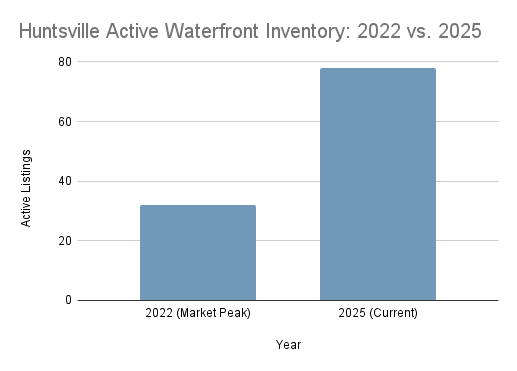
Inventory expanded year after year, while sales stayed in the same band.
Here’s the simplest explanation for why 2025 felt selective: inventory rose far more than demand fell.
-
Average active listings across Muskoka waterfront climbed from ~204 (2022) to ~504 (2025) – up ~147%.
-
Sales moved from 614 (2022) to 561 (2025) – down only ~9%.
Plain-English translation: this isn’t “nobody is buying.” It’s “buyers can compare.” In 2026, that changes everything about pricing strategy, presentation standards, and how quickly you need to adjust if the market tells you you’re off.
Muskoka is not one market anymore (sales pace by township)
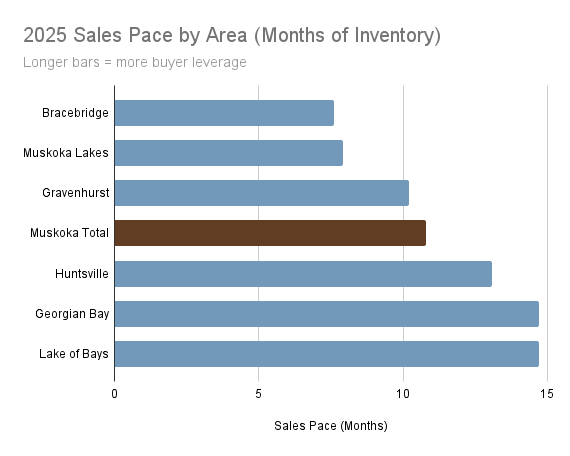
Higher months of inventory = slower market = more buyer leverage.
How to read this: Months of inventory estimates how long it would take to sell what’s currently listed at the current sales pace.
-
Lower = faster market (less choice, less time, less leverage)
-
Higher = slower market (more choice, more time, more leverage)
2025 snapshot (waterfront only):
-
Fastest pace: Bracebridge (7.6), Muskoka Lakes (7.9)
-
Middle: Gravenhurst (10.2)
-
Slow: Huntsville (13.1)
-
Slowest: Georgian Bay (14.7), Lake of Bays (14.7)
What this means: in 2026, the right strategy depends heavily on where you are. “Muskoka is hot” and “Muskoka is slow” can both be true – at the same time.
The “average price” headline problem
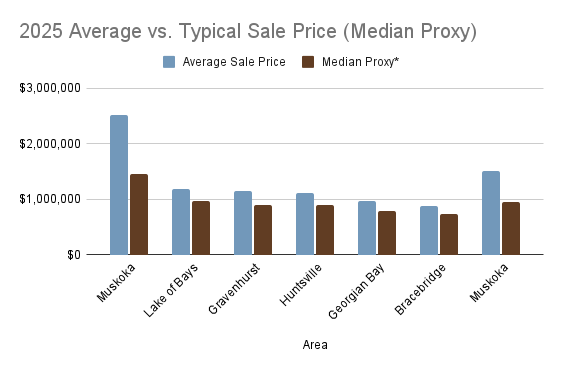
Caption: Average prices get pulled by outlier sales; “typical” helps you set realistic expectations.
You’ll often see headlines like “Average Muskoka price is $X.” That’s not useless – but it can be misleading, especially in luxury-heavy areas.
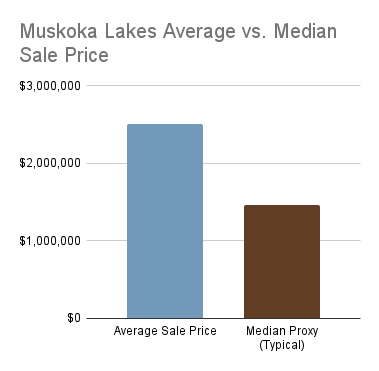
Example: Muskoka Lakes (2025)
-
Average price: $2.51M
-
Typical sale price (directional): $1.46M
That gap matters if you’re pricing a property or making an offer. Waterfront outcomes are driven by micro-market details – lake, exposure, access, condition, and shoreline quality – so the smartest comps are the ones that truly match your property.
Note: We use a Median Proxy to track these trends. Learn how the median proxy affects Muskoka market data.
Township snapshots
Township of Muskoka Lakes – the liquid luxury core (with an “average vs typical” gap)
Key stats (2025): Avg price $2.51M • Sales pace 7.9 • Days 54 • SP/LP 95.3%
-
If you’re selling:
-
You can still get a strong result – but only if you’re the clearest value in your sub-niche.
-
“Almost right” gets punished with time; be sharp early and adjust quickly if needed.
-
-
If you’re buying:
-
You can be selective without shopping in a dead market – quality still moves.
-
Leverage often shows up in terms, conditions, and stale listings, not always huge headline discounts.
-
Huntsville – resilient pricing, heavy competition
Key stats (2025): Avg price $1.12M • Sales pace 13.1 • Days 54 • SP/LP 94.1%
-
If you’re selling:
-
Bigger selection means you’re competing harder – presentation + pricing discipline are non-negotiable.
-
“Resilient” doesn’t mean “easy sale.”
-
-
If you’re buying:
-
Price levels held up more here – but you still have leverage because pace is slower.
-
Negotiate with comparisons + clean conditions strategy, not just price.
-
Bracebridge – value + liquidity (buyers negotiate harder)
Key stats (2025): Avg price $880k • Sales pace 7.6 • Days 59 • SP/LP 95.1%
-
If you’re selling:
-
Don’t “test” high. Time creates leverage against you in a selective market.
-
Give buyers a reason: condition, clarity, and pricing that fits the moment.
-
-
If you’re buying:
-
One of the clearest “value + still trades” combinations.
-
Good listings can still go – move fast when the value is obvious.
-
Gravenhurst – the strongest correction story (slower liquidity)
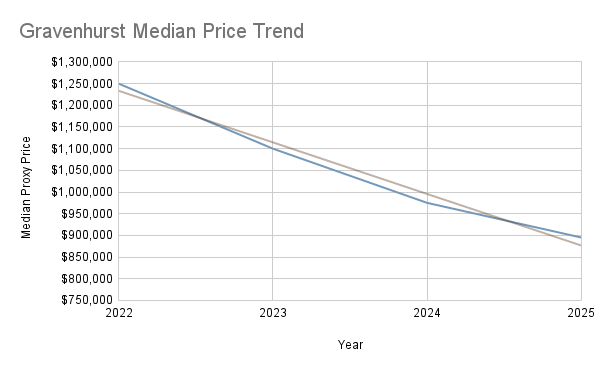
Key stats (2025): Avg price $1.15M • Sales pace 10.2 • Days 69 • SP/LP 94.5%
-
If you’re selling:
-
Overpricing can turn one season into two. Aim for the clean outcome, not the hopeful one.
-
Plan your pricing cadence before you launch.
-
-
If you’re buying:
-
Correction-created opportunity exists – but pick for quality; slower pace can reflect weaker demand for certain property types.
-
Georgian Bay – leverage shows up as time + choice
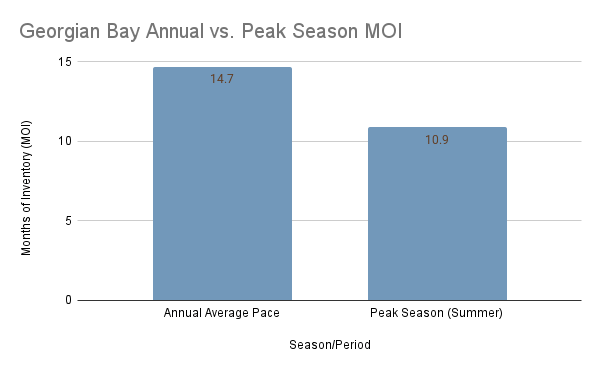
Key stats (2025): Avg price $968k • Sales pace 14.7 • Days 121 • SP/LP 96.2%
-
If you’re selling:
-
The biggest risk is time. “Testing” too high can quietly donate a season.
-
You need a plan: condition strategy, pricing cadence, and flexibility on terms.
-
-
If you’re buying:
-
Your leverage is patience + comparison.
-
Negotiating strength is real even if averages don’t scream “discount.”
-
Lake of Bays – slow pace + clearest concessions on closed deals
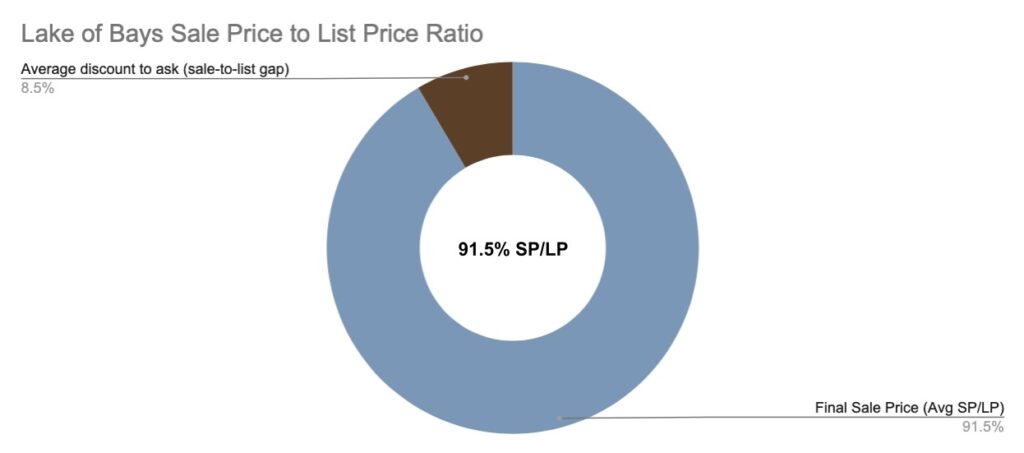
Key stats (2025): Avg price $1.18M • Sales pace 14.7 • Days 99 • SP/LP 91.5%
-
If you’re selling:
-
Buyers aren’t stretching like they did – concessions are more common.
-
Sharper number + flexible terms = better odds of a clean result.
-
-
If you’re buying:
-
One of the strongest leverage environments: slower pace, longer timelines, clearer discounting behavior.
-
Use that leverage carefully: negotiate, but don’t compromise on fundamentals.
-
Summer reality check (Jul-Sep 2025): it’s not just winter
People love to dismiss slow metrics as “seasonality.” So here’s the myth-buster: even in peak cottage months, the core vs fringe speed difference remains.
-
Muskoka Lakes: MOI ~6.93, LDOM ~52
-
Bracebridge: MOI ~6.78, LDOM ~38
-
Gravenhurst: MOI ~9.06, LDOM ~69
-
Georgian Bay: MOI ~10.97, LDOM ~69
-
Lake of Bays: MOI ~10.58, LDOM ~91
-
Huntsville: MOI ~14.48, LDOM ~61
Translation: slower areas aren’t only slow because it’s winter – they remain slower even in peak season.
What this means for you if you’re selling waterfront in 2026
-
The market rewards clarity: sharp pricing, strong presentation, and a plan to adjust quickly if the market tells you you’re off.
-
In the faster cores (especially Muskoka Lakes), buyers exist – but they’re selective because choice is deeper than during the boom.
-
In slower markets (Georgian Bay, Lake of Bays), the biggest cost is often time. “Testing the market” can become a multi-season listing.
Footnotes
-
Sales and dollar volume are summed across months to produce annual totals.
-
Calculated average price = annual dollar volume ÷ annual sales (volume-weighted).
-
Months of inventory in this report = average active listings ÷ (annual sales/12).
-
Off-season distortion (if referenced) = simple average of monthly MOI values; can inflate in seasonal markets.
-
Typical sale price (median proxy, directional) is not a true annual median; it’s the median of monthly median sale prices and should be treated as directional.
FAQ
Is the Muskoka waterfront market a buyer’s market or a seller’s market in 2026?
It’s neither across-the-board. Based on 2025, Muskoka waterfront is multi-speed: some areas behave relatively “faster,” while others give buyers much more leverage.
How to use this: treat “Muskoka” headlines as background – your leverage comes from your township + your property type + current competing listings.
What does a “selective” waterfront market actually mean?
It means buyers have enough choice to say “no” more often. Great listings still sell; listings that feel overpriced or compromised sit longer and negotiate from weakness.
Seller takeaway: your job is to be the clearest value in your niche.
Buyer takeaway: you can negotiate without assuming the market is dead.
If sales were only slightly down from 2022, why did 2025 feel so slow?
Because inventory rose far more than sales fell – so buyers could compare and wait. That expands timelines and increases negotiation pressure, even if sales totals stay fairly stable.
Are buyers still buying waterfront in Muskoka?
Yes – what changed is how they buy. In 2025 they had the ability to be picky, re-check assumptions, and hold firm on price/terms when the value wasn’t obvious.
Translation: demand didn’t disappear; standards went up.
What is “months of inventory” (MOI) and why does it matter in Muskoka?
MOI is a pace metric: roughly how long it would take to sell what’s listed at the current sales rate.
-
Lower MOI → faster market, less buyer leverage
-
Higher MOI → slower market, more buyer leverage
How to use it: it’s a strategy number (pricing/timing/negotiation), not a “prediction” number.
What does SP/LP mean, and how should I interpret 94–96%?
SP/LP = sale price ÷ list price. In a selective market, lower SP/LP usually means more negotiation room and/or more frequent price adjustments before a deal closes.
Don’t overread it: SP/LP can be affected by overpricing (high list, normal sale) just as much as “discounting.”
Are bidding wars still happening on Muskoka waterfront?
They can—typically when a listing is rare, correctly priced, and cleanly presented within its niche. But broad, automatic bidding pressure is not what 2021 looked like.
Reality check: the market can still be competitive inside a sub-niche even while the overall market is selective.
Why does “average price” sometimes sound disconnected from what buyers actually see?
Because averages get pulled by outliers. A few very high-end sales can lift the average even if most activity is happening at a lower (more typical) level.
How to use this: treat “average price” as a headline context metric—use apples-to-apples comps for decisions.
What’s the difference between “average price” and “typical sale price” in this report?
-
Average price in this report = annual dollar volume ÷ annual sales (volume-weighted).
-
Typical (directional) in this report uses a monthly-median-based proxy (directional, not a true annual median).
Why it matters: it helps prevent misleading pricing decisions based on a single headline number.
Should I “test the market” with a high price and reduce later?
In 2025 conditions, “testing” often turns into staleness, and staleness creates leverage against you – especially in slower areas where time is the hidden cost.
Better approach: launch with a real plan: strong presentation + sharp pricing + a pre-decided adjustment trigger (timing + feedback based).
What’s the single biggest mistake sellers make in a selective market?
Confusing “more inventory” with “more time to figure it out.” In a selective market, your first positioning matters because buyers can compare immediately.
Seller play: be the clearest value early, not the “maybe later” listing.
How long does it take to sell a waterfront property in Muskoka right now?
It depends heavily on township and niche. Your 2025 figures show real differences in days on market by area – so the right expectation is micro-market specific.
Practical answer: expect longer timelines than peak boom years unless you’re in a faster pocket and priced perfectly.
When is the best time to list a Muskoka cottage?
Peak-season visibility helps – but timing doesn’t fix mispricing. If your strategy depends on “the season will save it,” it’s usually too high.
Seller guidance: pick a launch window you can support (prep + showing readiness), then price for the market you’re in – not the market you miss.
Is winter a bad time to buy or sell waterfront in Muskoka?
Not automatically. Winter can reduce casual traffic, but serious buyers still move – often with clearer negotiation posture and fewer emotional decisions.
Seller reality: winter listings must be extremely dialed-in (access, presentation, showing logistics).
Buyer advantage: winter can be good for finding motivated sellers and clearer terms.
What concessions are common in a selective waterfront market?
More flexibility shows up as: longer condition periods, inspection/financing conditions, repair credits, inclusions (boats, docks, equipment), closing-date flexibility, and price adjustments based on inspection findings.
Buyer move: negotiate the full package, not just price.
Seller move: decide what you’ll give on terms so you don’t improvise under pressure.
How should buyers negotiate without losing the best property?
Use a two-track approach:
-
Stale/overpriced inventory: negotiate hard (price + terms).
-
Rare, correctly priced inventory: negotiate smart (clean offer structure, strong timing, fewer friction points).
Key: your leverage is strongest where selection is deepest – don’t apply the same playbook everywhere.
What’s missing from township-wide data like this?
It won’t fully capture micro-factors like lake/waterbody, access type, winterization quality, shoreline characteristics, or ultra-specific amenity premiums.
That’s why: the blog/report sets market posture, and your actual pricing/offer strategy still needs a micro-market comp set.
Can you break this down for my specific lake + property type?
Yes – and that’s the point of the strategy layer. Township-level data tells you the climate; micro-market comps tell you the price and tactics.
If you want an apples-to-apples comp read (lake + exposure + access + condition), email Catharine at cath@cottageinmuskoka.ca.